Update: Jan 10, 2025
There are many ways to optimize your email marketing campaigns, such as making sure your newsletter is mobile friendly, improving your subject line, adding a catchy CTA, etc. However, to know if an email is successful or not, you need to know how to measure its performance.
How to measure the success of your email marketing campaigns?
Today, data is more important than ever, so you need to know which KPIs to track based on your goal. Is it to generate more leads, drive more traffic to your website or increase your online sales with a promotional code?
Once you have determined your strategic goals (there may be several), it remains to determine the key performance indicators to follow in order to evaluate the progress of your email campaigns.
Email Marketing KPIs You Must Know
1) Click-through rate
What is the click-through rate?
The click-through rate (CTR) indicates the proportion of recipients who received your email and clicked on a link. In short, it represents the commitment of your customers to your email marketing campaign.
How to calculate the click-through rate?
(Total number of clicks ÷ Number of emails delivered) * 100
Example:
(137 clicks ÷ 6,368 emails delivered) * 100 = 2%
The click-through rate is probably the most used KPI by marketers since it allows you to easily measure if the email is performing well or not. Moreover, you can calculate the CTR for each email sent without any problem and discover which promotions are the most popular or which blog post is the most viewed on your website.
Recording a high click-through rate also allows you to increase the number of visitors to your website, hence the importance of integrating “calls to action” (CTA) in your email.
What is the average CTR?
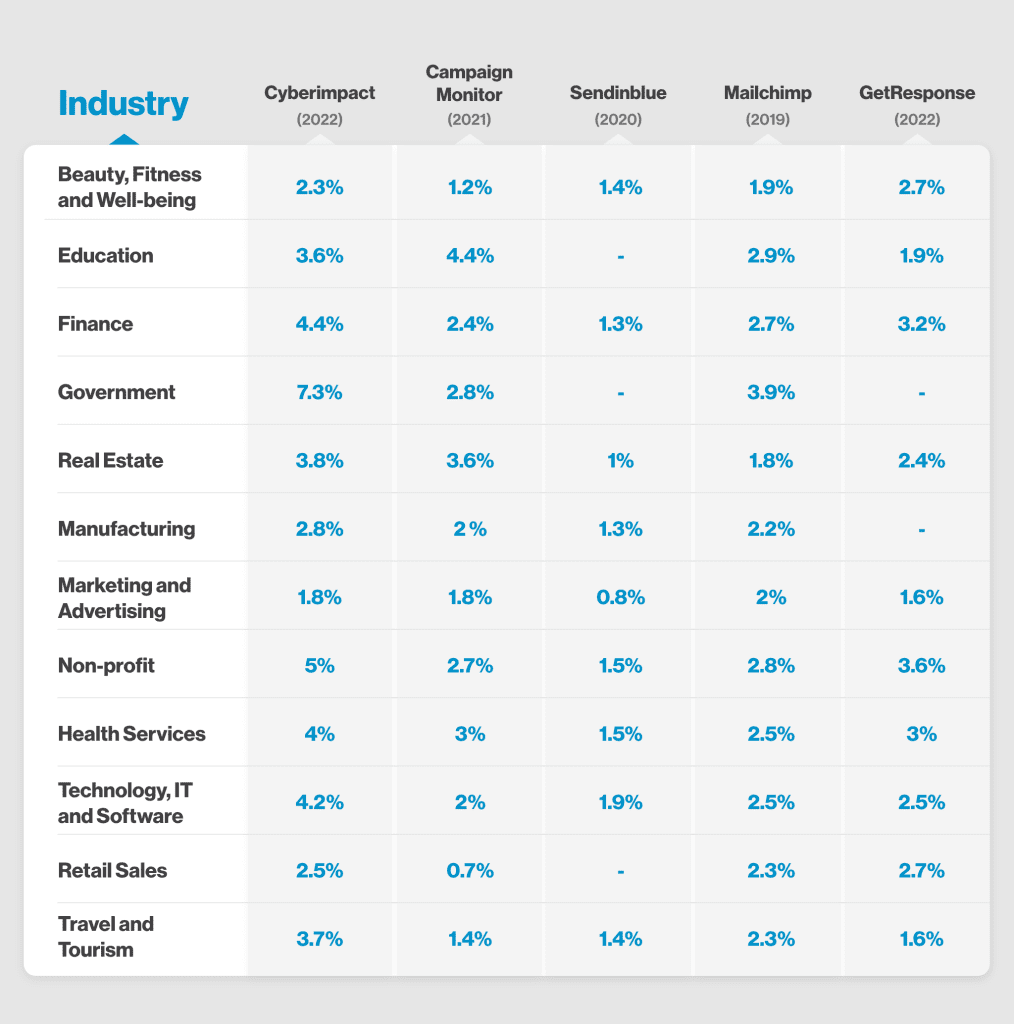
The average click-through rate for an email can range from 1.27% to 4.29% (2019-2021 data from Cyberimpact, MailChimp, Campaign Monitor, Sendinblue and GetResponse).
What is the average click-through rate by industry?
What is a good click-through rate?
With the data collected above, we could say that a good average click-through rate is between 2 and 5%. Of course, for some industries, this percentage tends to be higher. There are many other reasons for a higher rate, such as a great promotion, an event that has been anticipated for several months, etc.
How to optimize your CTR?
There is no absolute science to increasing click-through rates, however, we can give you some quick tips from our experience and from testing different methods. It is also important to have a quality website or landing pages, otherwise users may leave immediately with the feeling that they had a bad user experience.
- Keep the subject line short, concise and interesting
- Prioritize short (one message) emails
- Segment your contact lists to send personalized content
- Integrate one or more eye-catching CTAs (bright color, clear text, action verb, etc.)
- Work on the visual aspect of your email to make it easier to read
- Make sure your email is compatible on mobile devices
Most email marketing software automatically shows the click-through rate for each of your mailings, so you don’t have to do the math.
2) Conversion rate
What is a conversion rate?
It represents the number of email recipients who clicked on your link and performed a desired action such as filling out a form on a page of your website or making a purchase on your online store.
How to calculate the conversion rate?
(Number of people who completed the desired action ÷ Total number of emails sent) * 100
Example:
(70 people bought a product on my website ÷ 6,000 emails sent) * 100 = 1%.
Many people think that the conversion rate is only related to the number of sales you make. In reality, it represents the action that your user must take according to your marketing goal.
The first step of an email is to open it, click on the call-to-action (CTA) button and then convert your subscriber. It is therefore important that your CTA has a direct link to your marketing goal and desired conversion. Here is a list of example marketing goals:
- Fill out a form to download a guide
- Register for an event or webinar
- Request a product or service demonstration
- Request a free trial
- Purchase a product using a promotional code
If your main goal is to generate leads, conversion rates are very important since they let you know which newsletter or CTA works best. You might discover, for example, that your subscribers would rather have a 20% discount to make a purchase than a promo code that gives a $50 discount. Or, if your prospects are more interested in requesting a demo than creating a free account to test your software.
3) Open rate
What is the open rate?
It’s the percentage of recipients who opened your email. This indicator is important because it shows the interest of your recipients to open an email just by seeing your subject line.
How to calculate the open rate?
(Number of emails opened ÷ Number of emails delivered) * 100
Example:
(2,000 emails opened ÷ 6,000 emails delivered) * 100 = 33%
There are two different types of open rates:
- The total open rate refers to the number of times your email was opened. The same user who opens the same email twice would therefore be counted twice.
- The unique open rate corresponds to a single email opening for the same user. In this case, a person who views the same email multiple times would still be counted only once.
However, you must be careful, the open rate is not 100% accurate since an email is only considered “opened” if the recipient also downloads the images embedded in your email. In addition, Apple users have the option to enable the “Mail Privacy Protection” feature since 2021, allowing them to protect or not their email activity and prevent email senders from obtaining their information.
Also, it is likely that a large percentage of your subscribers have image blocking enabled on their email. This means that even if they open your email, they will not be counted in your open rate.
Furthermore, open rate is not an accurate measurement, as it can under or overestimate your actual numbers. Instead, we recommend focusing on the click-through rate, which has a direct impact on your marketing goals.
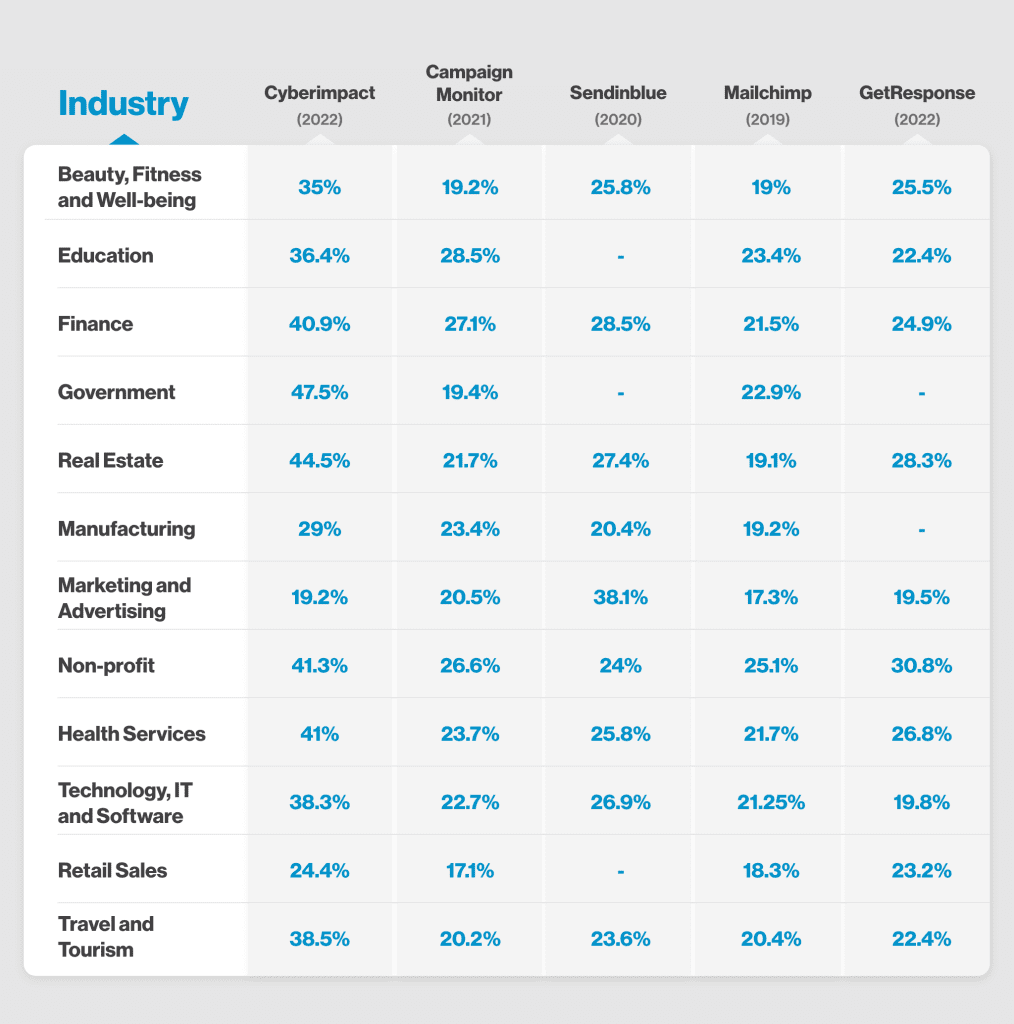
What is the average opening rate by industry?
What does it mean when you have a good open rate?
While open rates vary greatly from industry to industry, a good open rate usually means that you’ve managed to engage your readers with a catchy subject line or that you’ve targeted your audience well; for example, with a personalized subject line that includes the recipient’s name. You may also have created a relationship of trust with your subscribers. When they see your sender’s name, they trust your offer and your content.
Interesting fact: If the user activates Apple’s privacy option, all images are downloaded automatically by Apple’s servers, even if the subscriber does not open the email. This means that it is no longer possible to know when and if an e-mail was actually opened.
4) Delivery rate
What is a delivery rate?
It corresponds to the percentage of recipients who received your email in their mailbox.
How to calculate the delivery rate?
(Number of emails delivered ÷ Total number of emails sent) * 100
Example:
(6,368 emails delivered ÷ 6,368 emails sent) * 100 = 100%
There are several reasons that can cause a poor delivery rate. It can be caused by a low reputation score of the sender, since it could be considered as spam. It is also possible that you have inactive or non-existent emails in your mailing lists, which is why it is important to regularly clean up your database.
Interesting fact: The reputation score, called Sender Score, is an index between 0 and 100 that measures the reputation of the IP addresses of the servers you use to send your emails. The higher your score, the more likely you are to get into your subscribers’ mailboxes and not be considered as spam by spam filters.
How to improve your delivery rate?
- Set up a double opt-in confirmation
- Use a professional email address
- Be consistent with your sender name
- Segment your contact lists
- Clean up your contact lists
- Manage subscriber expectations (make sure they understand what they are subscribing to)
- Monitor spam complaints
- Add a text version to your email
5) List growth rate
What is the list growth rate?
This is the number of new subscribers that have joined your list. A growing list is a positive sign that your marketing efforts are paying off.
How to calculate the growth rate of a list?
([(Number of new subscribers) minus (Number of unsubscribes + email/spam complaints)] ÷ Total number of email addresses on your list]) * 100
Example :
(300 new subscribers – 25 unsubscribes and spam complaints) ÷ 6,000 email addresses on the list * 100 = list growth rate of 4.5%
Remember, it’s best to have a healthy contact list and to clean up your subscribers regularly. It’s better to have a smaller list of quality contacts than a large unqualified list. By having subscribers who are genuinely interested in your brand or newsletter, you will have a better chance of making conversions.
In addition, it is normal to lose subscribers along the way. On average, there is a 0.1 to 0.2% unsubscribe rate for each weekly mailing you send. If you send a newsletter to 6,000 contacts and 60 of them unsubscribe, this represents 1%, which is quite normal. However, if you are losing a large number of subscribers with each mailing, perhaps you should ask yourself the following questions:
- Does your content add value to your subscribers?
- How often should you send communications?
- Are your mailings relevant to your contacts’ interests?
- Is your content easily readable?
6) Bounce rate
What is the bounce rate?
It shows the percentage of emails that could not be successfully delivered to the recipient’s inbox.
How to calculate the bounce rate?
(Total number of emails bounced ÷ Number of emails sent) * 100
Example:
(100 emails bounced ÷ 6,000 emails sent) * 100 = 1.6% bounce rate
There are two types of bounces:
- The hard bounce: Usually indicates a permanent delivery problem. In most cases, the email address is either invalid, disabled or non-existent. It is also possible that the recipient’s mail server has completely blocked the delivery of emails, so you will be considered as spam.
Generally, email addresses that experience a hard bounce will be automatically cleaned from your contact list. Otherwise, it will be up to you to manually remove the affected email addresses, as Internet Service Providers (ISPs) use bounce rates as one of the main factors in determining an email sender’s reputation.
- The soft bounce: Usually indicates a temporary delivery problem. The email is valid, but the recipient may be experiencing difficulties with their server or their inbox may be full.
Usually the problem solves itself. You can simply resend the communication. However, if the same email address experiences multiple soft bounces, this one could possibly be considered a hard bounce.
How to reduce your hard bounce rate?
- Send regular newsletters to keep your contact information up to date
- Choose the double opt-in option when validating email addresses to ensure compliance.
7) Unsubscribe rate
What is the unsubscribe rate?
It’s the percentage of recipients who unsubscribe from your mailing list by clicking on the mandatory unsubscribe link at the bottom of your emails.
This KPI lets you know if your mailings are relevant or not. However, it should not be relied upon 100%, as some subscribers who receive too many emails or are not interested will simply delete your email or ignore it without unsubscribing. The unsubscribe rate can be useful when after a single mailing, a large number of people unsubscribe. Perhaps then your communication was not relevant.
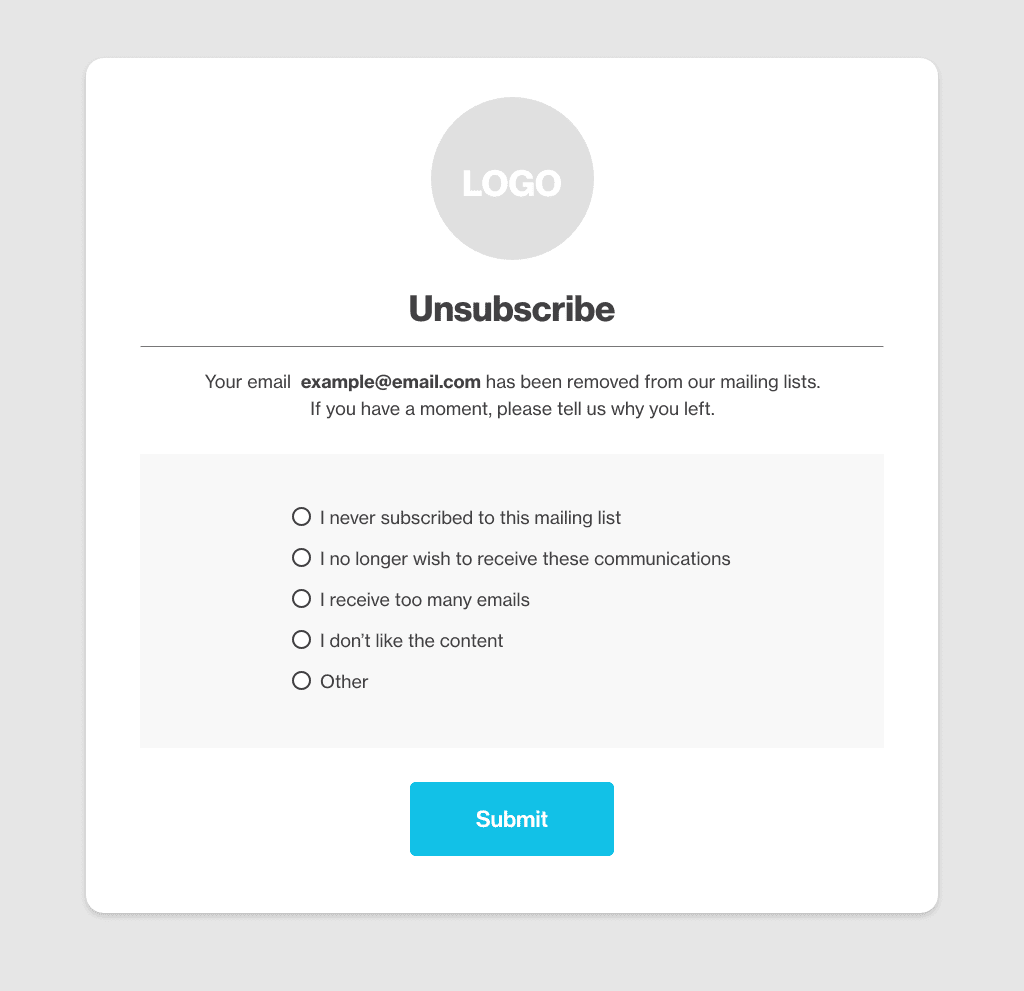
To understand the reason why some subscribers asked to be removed from your contact list, we advise you to add a questionnaire in your unsubscription process.
Measure the performance of your email marketing campaigns with Cyberimpact
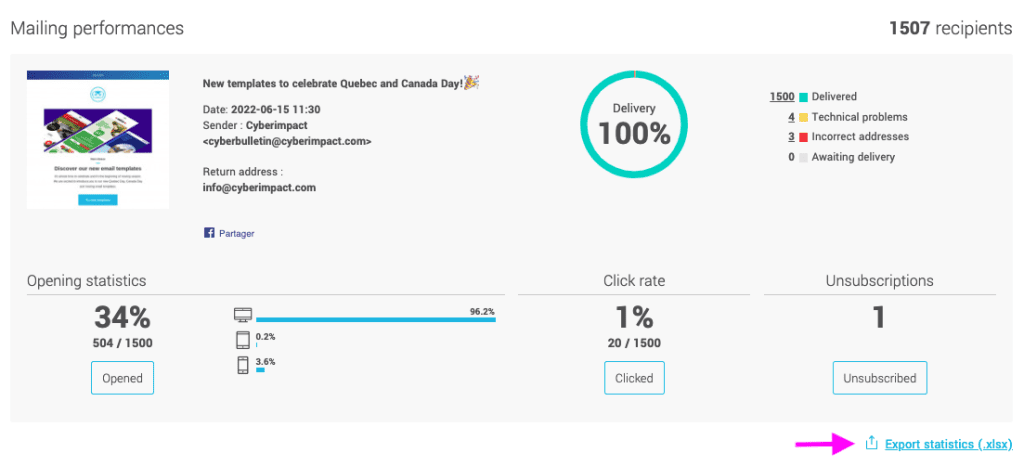
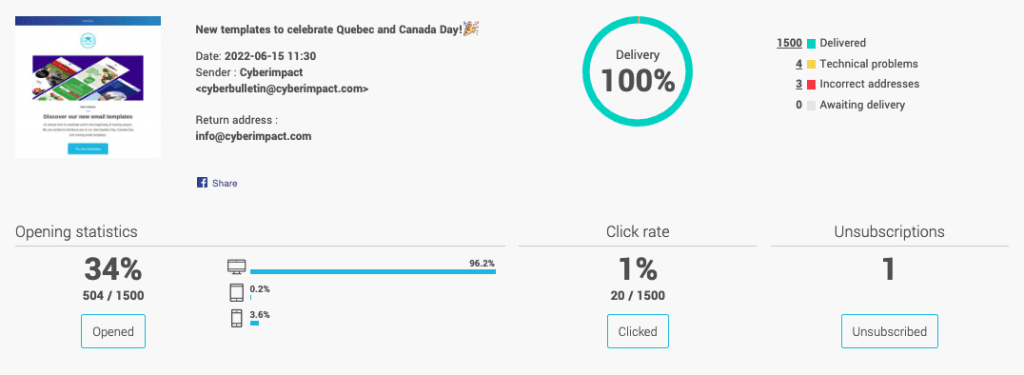
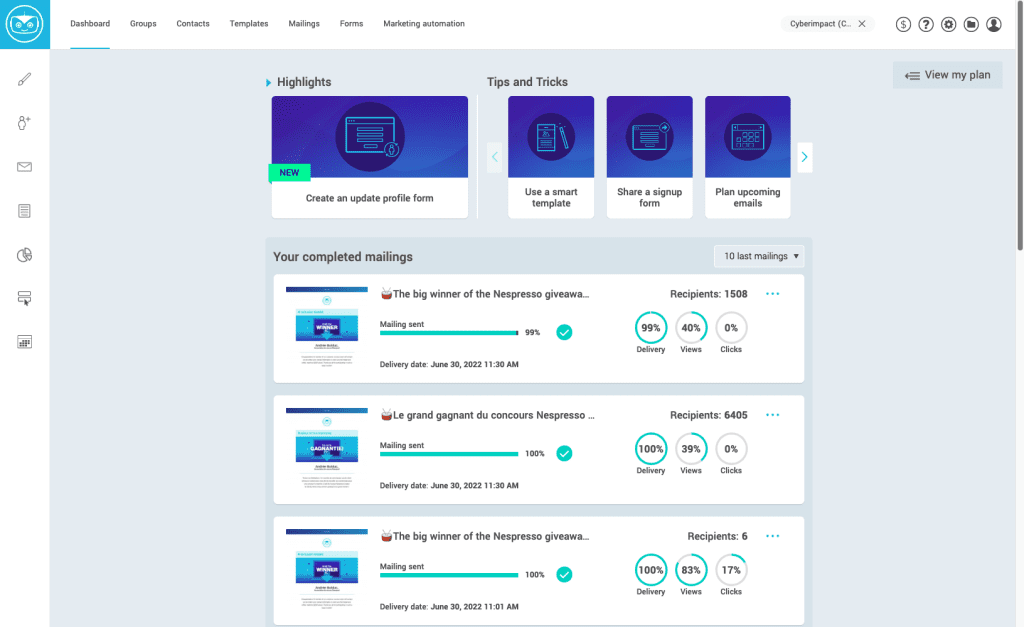
With Cyberimpact, an email marketing tool, you can easily follow the performance statistics of your emailings. As soon as you enter your dashboard, you can see the delivery rate, the open rate and the click rate of your last 10 mailings. You can also see which contacts clicked on the links in your email.
Furthermore, you can compare the performance statistics of your different email lists. For example, you would like to know if the opening rate of the French group is higher than the English group.
The View your statistics menu gives you an overview of your account’s global statistics such as the number of subscribers, unsubscribed contacts, express or tacit consents, incorrect addresses, mailings sent and the total of openings. If you prefer to check the statistics from Excel, simply select the option to export your data.